As a UX/UI designer, I have a passion for creating beautiful and meaningful visual stories.
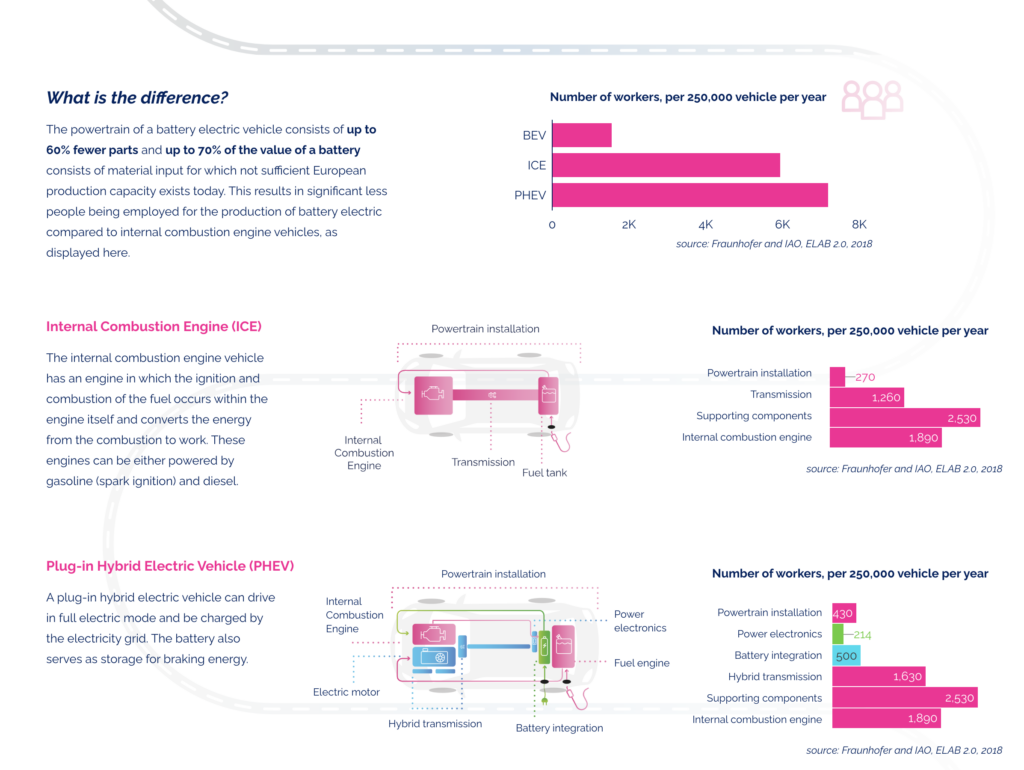
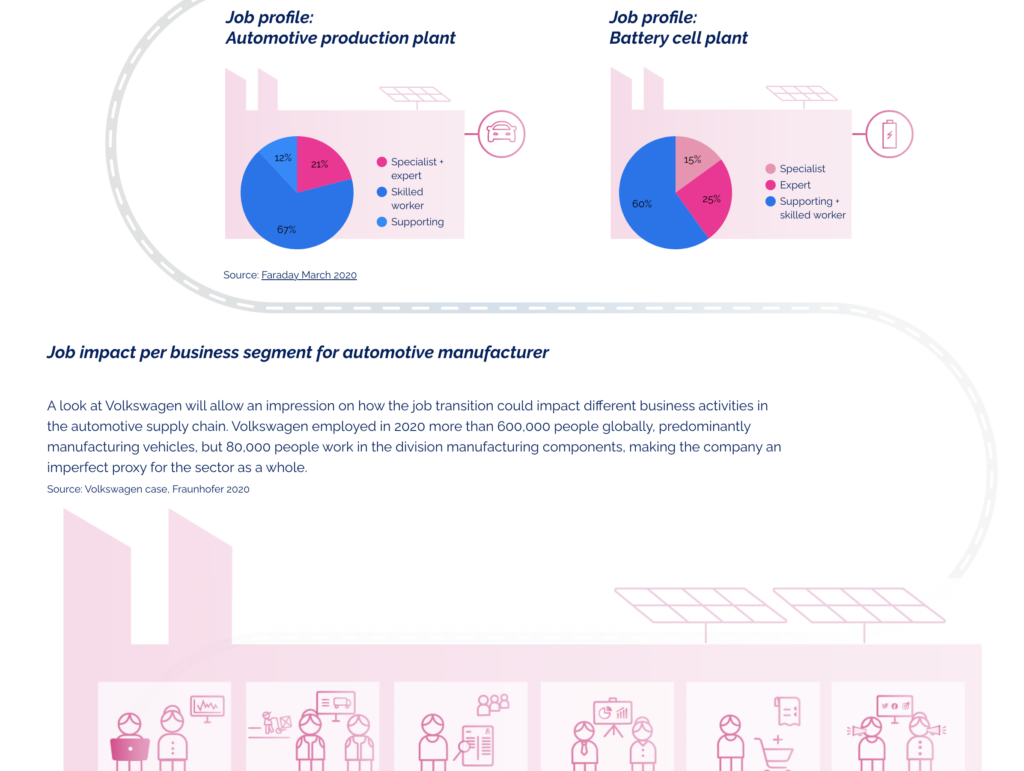
Sometimes we get asked to make technical charts clearer and more understandable for a broader audience and to create these visualizations using Looker Studio (previous Google Data Studio) or Tableau, which, unfortunately, aren’t exactly design-oriented software tools.
When creating a dashboard, it is crucial to consider your target audience. While highly technical data analysts may prioritize functionality over aesthetics, a Sales & Marketing team with less technical expertise is likely to respond favorably to clear and simplified visualizations. In this case, storytelling becomes essential for making a strong first impression.
In this blogpost I’ll share some insights into the limitations we face and provide tips and tricks to help you overcome these obstacles and create visually compelling and easily understandable visual stories.
1. Embracing layout limitations
Let’s face it – when it comes to layout options, Looker Studio and Tableau can sometimes feel restrictive. But don’t let that discourage you! Embrace the available features like containers and grids. They may not offer the same flexibility as professional design software, but they can help you maintain organization and alignment within your visualizations to keep consistency.
2. Making colors and typography shine
While the customization options for colors and typography might not be as extensive as we’d like, both Looker Studio and Tableau allow you to add custom colors to your visualizations.Choose colors that complement your data and make sure to pay attention to font sizes, weights, and styles to establish a clear visual hierarchy. When adding custom colors, it’s important to ensure that the colors provide sufficient contrast within your charts to comply with accessibility standards. This ensures that your visualizations are inclusive and accessible to all users.In Looker Studio you can even extract theme colors from an image, (for instance an image of a styleguide) that way you don’t even have to retype all the hexa codes anymore.
3. Layering and transparency
Adding depth and visual interest can be a challenge within the constraints of these tools, but fear not! Experiment with layering elements and adjusting their transparency. Overlay different chart types, blend visuals with annotations, and create unique combinations to enhance the storytelling aspect of your visual narratives.
4. Embrace templates and custom styles
Looker Studio and Tableau offer a variety of pre-built chart styles and templates. While they may not cater to all your design needs, they can serve as a starting point. Customize these templates further by tweaking colors, labels, and other details to align them with your unique visual narrative.
5. Expanding beyond the dashboard tool
Sometimes, we must think outside the box. If the built-in features of these platforms aren’t cutting it, consider leveraging additional design tools. Create custom graphics, icons, or illustrations in software like Adobe Illustrator or Canva (we won’t tell anybody), and then import them into Looker Studio or Tableau to add that extra touch of creativity to your visualizations.
6. Exploring interactive tooltips
Adding tooltips to titles can be a helpful way to provide extra information or clarify the purpose of the chart or visual element. It allows users to gain deeper insights and enhances the overall usability of the dashboard or report.
Both Looker Studio and Tableau provide the ability to add tooltips to titles and other elements, and for those seeking non-standard tooltips, there is even room to incorporate custom code to achieve the desired effects.
7. Simplicity and clarity are key
Amidst all the struggles, it’s important to remember the golden rule of design: simplicity and clarity. Avoid overwhelming your charts with excessive data points or visual elements. Instead, focus on highlighting key insights and ensuring that the most important information shines through.
If you’re not restricted to using a dashboard program and can design a dashboard directly in Figma, you have much more flexibility in creating charts and the way you present filters or tooltips. Always discuss with development whether these designs are technically feasible for them in terms of implementation.
Although designing clear visual stories within the limitations of Looker Studio and Tableau can be challenging, it’s not impossible. So let’s make the most of these data platforms, channeling our creativity to craft our unique visual narratives, even if we encounter some playful frustrations along the journey.


