Data visualization for River Woods
River Woods is a clothing and fashion retailer, founded in 1995. They live by the motto “Small details make a world of difference”.
Thanks to the incredible success of their initial menswear collection in Belgium, they soon expanded their activities to France and The Netherlands. 22 years later, in 2017, they have over 1500 points of sale worldwide, as well as a web shop with a prominent online presence.
The goal
River Woods mainly relied on Google Analytics data, which isn’t always 100% accurate. The goal of this project was to centralize all the data of the online activities into a set of dashboards, combining both Google Analytics and Magento to guarantee a flawless and accurate representation.
All data regarding online activities that went beyond the web shop (such as Facebook marketing efforts) had to be easily accessible in the same environment. It was important that every department could easily comprehend all the data with a quick glance at the dashboards.
What we did
Approach
Through the use of the Klipfolio dashboarding tool, our dashboarding experts were able to fulfill all of the clients’ requirements:
- Insight into the overall performance of the online activities, both high level and at a traffic source level.
- Detailed insights into the performance of the most important KPIs (Key Performance Indicators)
- Integration of data from non-Google services (such as Magento, Facebook and other back-end data)
- Review of the available historical data for benchmarks, trends and other comparisons.
- Simple, easy to understand and accurate representation of the data.
The results
This resulted in a high quality set of dashboards:
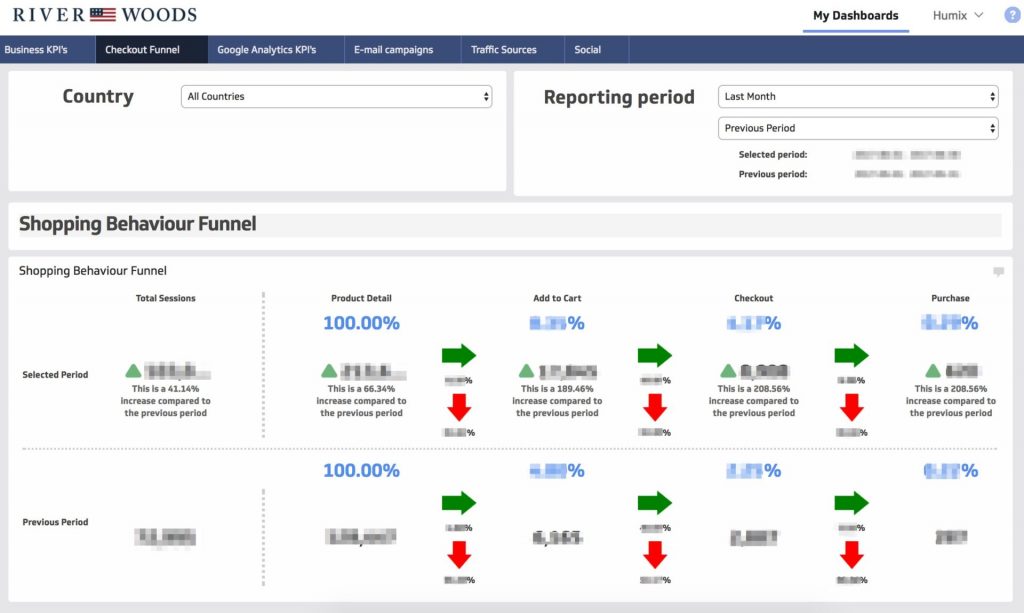
- Business KPI dashboard for management
- Checkout funnel and shopping behavior dashboard
- Google Analytics KPI dashboard
- E-mail performance dashboard
- Dashboard showing all different traffic sources and conversion channels
- Social dashboard showing all online marketing efforts
Next steps
The dashboards are set-up in a way the data is collected and visualized automatically. Additionally, the client has the option to select date ranges and visualize the data by any period in time. Therefore no further maintenance is required. It is only when campaigns, URL changes or new traffic sources are added, that an update might be necessary.